Analyzing Website Visitor Behavior: Mobile vs. Desktop Users
Note: this is a guest blog post I was asked to write by the owner of a digital marketing agency in California. I'd never met him, but he contacted me saying he liked my writing and wanted me to dig deep into the data I have access to and write a post on the differences between mobile and desktop traffic. I was delighted to do so, and here is the end result. I hope you like it.
For nearly seven years, I’ve been designing, building, and marketing websites, and for almost that entire time, there’s been a question in the industry that hasn’t been answered yet to everyone’s satisfaction and has always bugged me.
That question is: "What should a website owner do to optimize a website for mobile visitors?"
We’ve seen mobile traffic on websites since at least 2003 (albeit with extremely primitive and nearly useless browsers), but it’s grown to become such a phenomenon that as of this writing (2013), some research firms estimate that nearly 25% of all traffic on the entire Internet is the result of mobile users (!).
So while I’ve always been interested in providing the best browsing experience for mobile users, my mind isn’t completely made up on the best way to fit the right content on a smaller screen. But I think what is more important first is to ask a different question: "Do mobile and desktop visitors use websites differently than each other or exactly the same?" Of course, asking this generates many smaller, tangential questions, such as "Is user intent different based on the device being used?" and "Do different devices have unique considerations or time constraints in the way people use them?"
For example, is a website visitor that's viewing my website on a mobile device going there for the same reason? Or is it entirely different from a desktop user? Do they want a different kind of content? Is a mobile user driving down the road, going through patches of spotty Internet reception and just wants a very quick answer like "what time does the store close"?
These are exceptionally complex questions with nuanced answers that would involve many steps (usability testing, UX research, heatmaps, eye-tracking, surveys, etc). I cannot derive the answers based on these criteria that aren't tracked with basic server logs. But what I can show from the data is a basic overview of their behavior, regardless of the intent. And that is still helpful information. My motto for the past few years in Internet marketing has been “data wins arguments,” so I’m going to refuse to argue about this issue until I see the data, which is exactly what I’m doing with this post.
I currently have access to the server data for over one thousand websites, so I sometimes like to go “gold mining” and comb through the server logs and test certain hypotheses I might have. In this case, I cherry-picked five websites I'll use to test my assumptions and see just how different a mobile visitor’s behavior is from a desktop visitor's, if at all. The five I chose are, I think, a good sampling. They're all from organizations in different industries, they have different business models (and goals), they have different target demographics, different locations, and the reasons people visit the websites are different for each. So while this is by no means a truly scientific survey, I’m confident in the statistics for the websites I’ve picked.
Here are the organizations I’ve chosen for this experiment:
- City Government
- Hot Tub Sales Company
- Restaurant Group
- Tourism Board
- Jeweler & Diamond Seller
I’m going to take some of the top analytical data reports and compare the desktop vs mobile users on each website, side by side, all else being equal, to see if there is any disparity in the way these two kinds of visitors actually use the websites in question. With that kind of data, you can actually start to make decisions on how to create our own mobile approach.
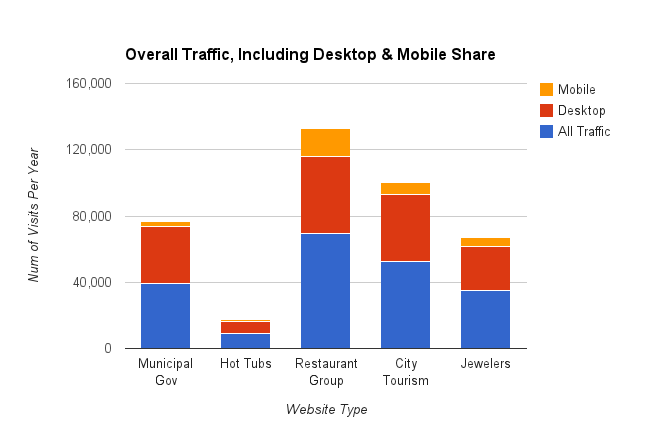
Let’s dive right in! First off, we’ll just look at all five websites with their total traffic for one calendar year (2012): desktop plus mobile.
Chart #1 - All Websites/All Traffic

Right off the bat, you can see that the Hot Tub Sales company gets the smallest amount of traffic (9,130 visits) while the Restaurant Group gets the most (69,175 visits). This is interesting for seeing the bigger picture but doesn’t give us any real info yet.
Conclusion(s): Nothing significant other than establishing a benchmark.
Chart #2 - Mobile vs. Desktop Share
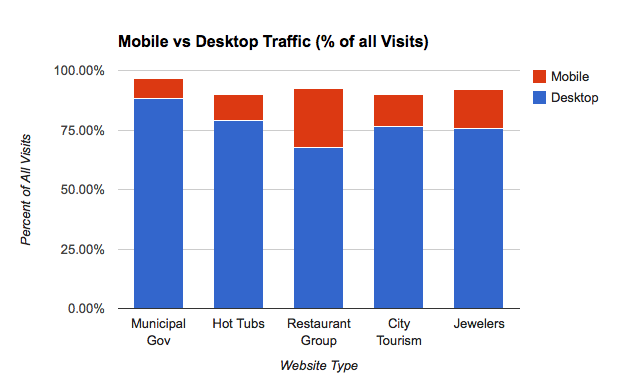 Now we’re really getting somewhere. First off, ignore the fact that none of the vertical bars reach a full 100% This is due to my excluding iPad traffic since (for now) I'm considering "tablets" a third option, not a true mobile or desktop visit. In chart #1, we saw that the restaurant group gets the most traffic overall, and from this chart we see it also has the highest share of mobile traffic as a percentage of overall visits (24.8%, to be precise). In contrast, while the city government has the third highest overall traffic, it has the lowest mobile share with only 8.2% of all visits coming from mobile devices.
Conclusion(s):
- Desktop users FAR outweigh mobile visitors on all five websites.
Chart #3 - Number of Pages Per Visit
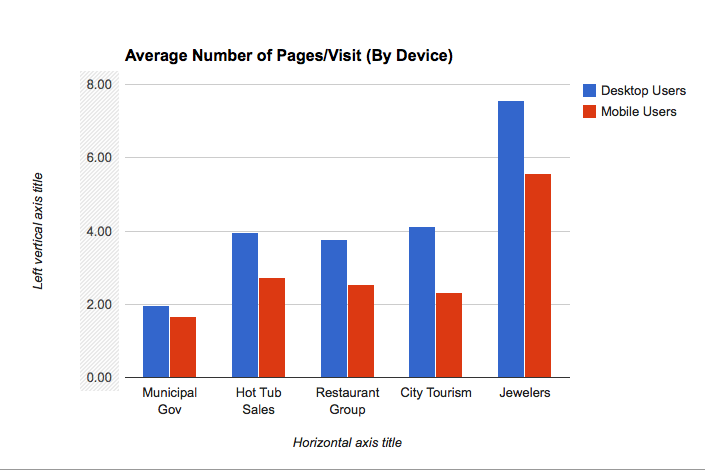 This one is interesting: the average number of pages viewed per visit proves that (at least in my random sampling of five websites), desktop users consistently view more pages per visit than the mobile users. So the anecdotal assertion I've heard many times that mobile users view fewer pages on average appears to be supported by the data. Also, as I'd expect, each industry is different. Note the breakdown below:
- City Government: Desktop = 19% more pages/visit
- Hot Tub Sales: Desktop = 45% more pages/visit
- Restaurant Group = Desktop = 48% more pages/visit
- Tourism Board: Desktop = 78% more pages/visit
- Jeweler: Desktop = 36% more pages/visit
While we could ponder all day long about why the discrepancy exists between these industries, I’m satisfied simply proving the point that mobile users do indeed view fewer pages on average.
Conclusion(s):
- Desktop users view more pages per visit on all websites than mobile users do.
Next, I want to focus on average time on site. Time on site is the metric that gets web designers and marketers all riled up when discussing mobile vs. desktop users. Someone will say “Mobile visitors only want to get on your website and find one piece of information then leave as quickly as possible because they’re probably walking down the street, or standing in line at the bank, etc.” Then someone else will say “Not true! Mobile users like to read just as much information as desktop users! I do all the time!” So here I am, putting on my “data wins arguments” cap, so let’s see what happens.
Chart #4 - Visit Duration
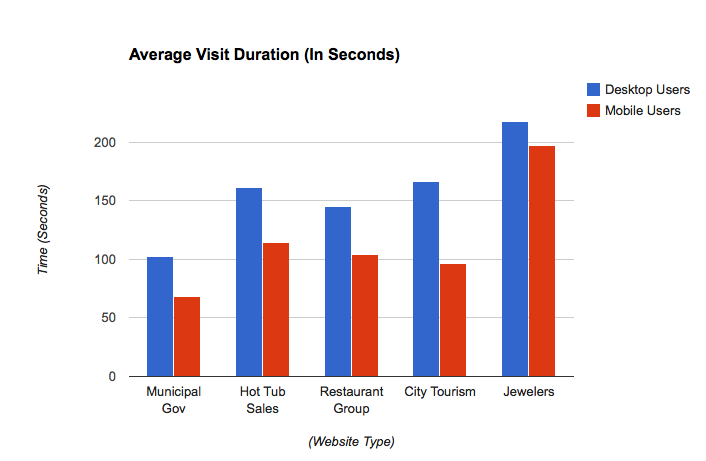 Hooray! We have conclusive evidence that mobile users do indeed spend less time on a website than desktop users... While it may be hard for you to see in the chart above, it shows that, at a minimum, desktop users spend 11% more on average than a mobile user, and, in the case of our city tourism website, they spend a whopping 73% more time on site.
Pontificate as you wish: there are many variables that could be at work here that would explain why there’s such a difference for each industry, but for today, all that matters is that ALL the websites have a greater visit duration from desktop users than mobile.
Conclusion(s):
- Desktop users spend more time on site than mobile users; between 11%-73% more.
Chart #5 - Bounce Rate by Device
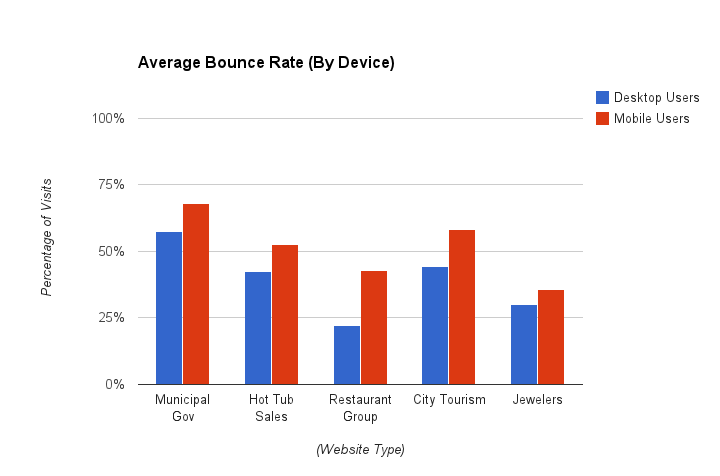
Check it out! More fantastic data showing drastic disparities.
- City Government: mobile = 18% higher bounce rate than desktop
- Hot Tub Sales: mobile = 24% higher bounce rate than desktop
- Restaurant Group: mobile = 95% higher bounce rate than desktop
- Tourism Board: mobile = 32% higher bounce rate than desktop
- Jewelers: mobile = 18% higher bounce rate than desktop
Yowza! What a difference! (In case you’re not familiar with the term “bounce rate,” it means the rate of visits where a website user shows up on a page and hits the “back” button or otherwise "exits" your website without clicking anywhere else). Now, as I’ve stressed many, many times in the past: a high bounce rate is not necessarily bad! Restaurants, incidentally, have always been my favorite example of this. If you’re visiting a restaurant’s website, it may very well be you’re only on their website to find out what time they close. ...or find a find their phone number. ...or see when happy hour starts and ends. ...or see if they have free parking. And on and on.
In fact, if a website is built well, it might be that all of that information is right on the home page, and so your user’s objectives—IN THEORY—can be accomplished entirely within a “bounce” in an analytics report. So while we generally say that a high bounce rate is something to avoid, you can still run a very successful website with a high bounce rate IF people get the info they need in one visit.
Conclusion(s):
- Mobile users have a higher bounce rate (in all cases) than desktop users; between 18%-95% higher.
Chart #6 - Day Of The Week
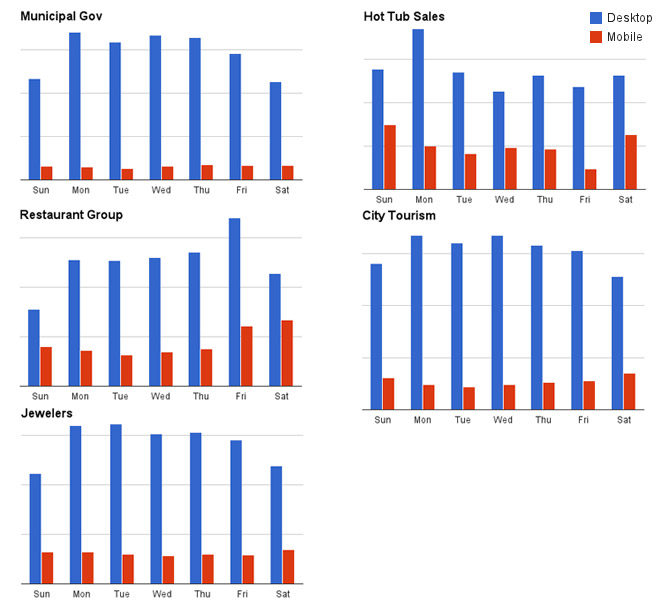 I've always wanted to test this one, not to see if there's a disparity in daily traffic since I'd assume each business has a natural weekly traffic pattern... but to see whether there's a difference in daily traffic peaks by device.
The first thing I see here is that the days with peak traffic are different for mobile vs. desktop users for each website! Here's the breakdown of peak traffic days, by device, for each day:
- City Government: desktop = Monday, mobile = Thursday
- Hot Tub Sales: desktop = Monday, mobile = Sunday
- Restaurant Group: desktop = Friday, mobile = Saturday
- Tourism Board: desktop = Wednesday, mobile = Saturday
- Jeweler: desktop = Tuesday, mobile = Saturday
What are we to make of this? I’m not exactly sure yet. It's clear that people do use their mobile devices and desktop computers at different rates depending on the day of the week. If I had to speculate, I’d generally guess that most people are at a desk during work hours on work days: if you notice, all five websites have their peak desktop traffic on weekdays (Mon, Mon, Fri, Wed, Tue) while four out of five of them have their peak mobile traffic on weekends (Sun, Sat, Sat, Sat). The only exception is the municipal government website, which peaks for mobile devices on Thursday).
Conclusion(s):
- All websites have peak desktop traffic on weekdays (Mon-Fri).
- 4/5 websites have peak mobile traffic on weekends (Sat & Sun).
- None of the peak days are the same for desktop and mobile.
Chart #7 - Seasonal Traffic Spikes
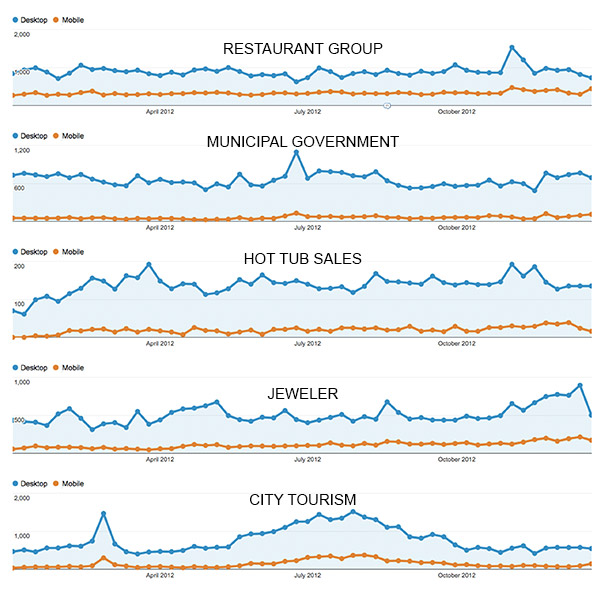
I next wanted to know if there was a device disparity in seasonal traffic spikes. The results kind of blow my mind: there’s an enormous difference between seasonal spikes in desktop and mobile users: the spikes and dips in traffic on desktop has wild variations up and down, while the mobile traffic is relatively steady all year long. Even when there are spikes in mobile traffic, as you can see, they often don’t correspond at all to the spikes in desktop traffic. The restaurant group, for example, has a huge spike in desktop traffic in November, while the needle barely moves for mobile users, and yet at the end of the year, desktop traffic declines while mobile traffic increases. The municipal government site has a huge spike in July and almost no increase at all from mobile. The hot tub sales website has several spikes in desktop throughout the year with no discernible spikes in mobile at all. The jeweler has an incredible drop right at the end of the year, while mobile remains steady.
I don’t have enough information to come to a conclusion for why these variations are so large; just the simple observation that they are. Mobile traffic seems to remain steady almost all year long. If I had more time, I would start to drill down deeper into which exact days correspond to which spikes. (For example, I would love to see what the huge spike is for the tourism board in March. People interested in a St. Patrick's day parade, perhaps? Why did the restaurant group see such a climb in late November? Are people shopping around for takeout food for Thanksgiving, or wanting to go out on Black Friday?).
Conclusion(s):
- Mobile traffic is more consistent all year and generally resists large spikes.
- Desktop traffic has many spikes throughout the year for all five websites, perhaps due to promotions, seasonal changes, etc.
Chart #8 - Return Visits by Device
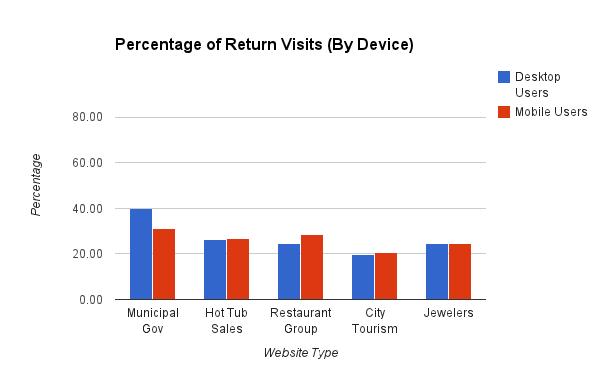 This one isn’t conclusive, but it’s still interesting. It shows that mobile users seem to return to websites at the same rate or slightly higher than desktop users. Meaning: a mobile user will come back to your website more than once at the nearly the same rate as someone using a desktop computer. This is surprising to me since so far we’ve seen that mobile users bounce more, view fewer pages, and spend less time on your site… but they come back for a return visit quite frequently: for example, 28% of all the restaurant group’s mobile visits are returning visits, which is pretty darn high, and they see 15% more return visits from mobile users than they do desktop users. In this case, only the municipal government website sees more returning visits from desktop users.
Conclusion(s):
- New vs returning visitor traffic is similar between desktop and mobile.
Chart #9 - Social Referral
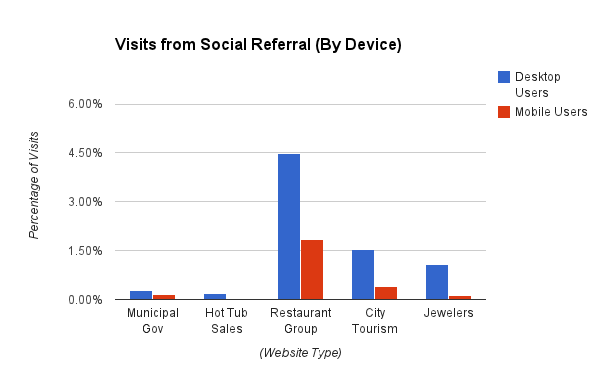 You knew I had to throw in something involving social media, right? Last, but not least, we have one of the most interesting charts so far, and one that shatters what was apparently an illusion I had: I used to think that mobile users were more "social" and interacted with websites more on mobile devices more than desktop users would, but check this out: desktop users have a much higher level of social referral (i.e. clicking through from a social networking site to your website) than mobile users do.
First of all, social media marketers take note: across the board, as a percentage of all traffic, social referrals account for 4.5% AT MOST, which is dismal if you’re trying to build your business with it. (The hot tub sales website saw the worst rate of mobile social visits: literally 0.01%!). Most of these websites had "organic search" as their number one source of acquisition, (which is part of why I’ve been a firm believer in Search Engine Marketing first and foremost, and have only suggested that businesses use social media to supplement a good search and content strategy first).
Here are the details:
- City Government: 60% greater social referral on desktop vs. mobile
- Hot Tub Sales: 6% greater social referral on desktop vs. mobile
- Restaurant Group: 41% greater social referral on desktop vs. mobile
- Tourism Board: 26% greater social referral on desktop vs. mobile
- Jewelers: 12% greater social referral on desktop vs. mobile
So while I’m certainly not knocking social media (because I do believe it’s important that organizations engage on social media), this is definitive proof that the overall impact is minimal unless you’re actively engaging potential customers on social networks (in this case, only the restaurant group was doing so) but even then, four out of five of these websites are only seeing social referral in the fractions of a percent of their visitors.
Conclusion(s):
- Social media referrals were MUCH higher with desktop users than mobile on ALL websites.
Recap of Conclusions & Final Takeaways
There you have it! We have just analyzed nine different metrics to look for deviations between mobile and desktop users. As I mentioned in the beginning, my intent was not to come to any major decisions about how you should build a mobile website or create a mobile strategy. But, I hope this can at least shed some light on the differences in the behavior of mobile users.
"If you’re a website owner, your next step is to run these test on your own website."If you’re a website owner, your next step is to run these test on your own website. View your analytics reports and split up the data by device to see if your own visitors exhibit any major differences—this can help you understand your website visitors, which, in turn, can help you understand your customers. As a quick recap, here are some of things we learned:
- Each industry and website had different overall traffic numbers.
- Desktop users were the large majority of visitors on all websites.
- Desktop users viewed far more pages per visit than mobile users.
- Desktop users spent far more time on each website than mobile users.
- Mobile users had a massively higher bounce rate than desktop users.
- Peak traffic for desktop users was a weekday in all cases, and in four out of five cases, peak traffic for mobile users was on weekends.
- Dektop and mobile users had different peak traffic days for each website.
- Desktop and mobile users show different seasonal traffic patterns, and desktop users have more significant seasonal spikes than mobile users.
- Mobile users return to your website at close to the same rate or potentially slightly higher than desktop users.
- Desktop users clicked through to each websites via social media referrals at a drastically higher rate than mobile users.
So go forth and test! Look at the data! Only when you’ve seen for yourself what your mobile users are doing can you truly address their needs. I’d love to hear what kind of stats you see on the websites you manage. Good luck, and feel free to leave comments below on your findings!
Originally published at www.greatleapstudios.com.